Are vaccinations safe?

According to the CDC, as of December 1st, 2021, 40% of the US population is not fully vaccinated. There is much debate over the efficacy and safety of the vaccine itself, so we offer the opportunity to explore some of the more controversial and misunderstood data to objectively explore the dangers of COVID-19 against the possible dangers of the vaccine.

We'll look at three separate datasets in this exploration. To view covid deaths, we'll use the CDC's COVID-19 Deaths by Week, Sex, and Age dataset, and to take a deep dive into vaccination rates, we'll use the CDC's COVID-19 Vaccinations in the United States dataset. We chose the CDC data because it is the most objective and vetted vaccination record and COVID-19 deaths record available. To explore alleged adverse effects from the vaccine, we'll use the US Dept of Health & Human Services Vaccine Adverse Event Reporting System (VAERS) dataset. It's worth noting that the VAERS dataset is not new- it's been around since 1990 to be used as an early indicator for any potentially dangerous vaccination side effects, and it is a completely voluntary system, so we would expect some bias and innacuracies in the data. We absolutely encourage you to read the disclaimer on their website to understand the limitations of the dataset.

Even with these limitations in the dataset, we chose to explore VAERS because it's been widely touted as proof that the vaccine is indeed dangerous. Not ones to take another's word for it, we decided to dig in on our own, and share our findings with you!

Our cleaned age group data can be found here, and our cleaned manufacturer data can be found here.


COVID-19 Deaths vs Vaccine Deaths

In the visualizations below, we compare the number of US COVID-19 deaths against the entire US population- not just those who have gotten sick. This allows us to look at a person's changes of both contracting AND dying of COVID-19, since not every individual will contract COVID and many non-symptomatic cases will go undetected. Bearing that in mind, please continue reading to compare the vaccine symptoms against the percent of the population that has died from COVID-19.


To interact with the visualizations, select an age group from the drop down menu to see the time series of percentage of COVID deaths vs. vaccine deaths for that age group. You can also choose whether you want to look at fully vaccinated or partial vaccinated individuals, which will only affect the vaccination numbers, since vaccines are not considered in the overal COVID-19 death rate.

Hover over the chart for more details and be sure to read the additional instructions under each chart title!


Percent of Deaths by Age Group

Covid death percentages are calculated based on the entire US population. Vaccination deaths, on the other hand, are only calculated based on the total vaccinated population as the denominator. As more people get vaccinated, the number grows. That's why our cumulative value is able to drop.


Counts of Deaths by Age Group

Comparative counts of deaths from COVID-19 and alleged deaths from the vaccine, according to the VAERS dataset.
To interact with the visualizations, select a vaccine manufacturer from the drop down menu to see the time series of percentage of COVID deaths vs. vaccine deaths for that manufacturer. You can also choose whether you want to look at fully vaccinated or partial vaccinated individuals, which will only affect the vaccination numbers, since vaccines are not considered in the overal COVID-19 death rate.

Hover over the chart for more details and be sure to read the additional instructions under each chart title!


Percent of Deaths by Manufacturer

Covid death percentages are calculated based on the entire US population. Vaccination deaths, on the other hand, are only calculated based on the total vaccinated population as the denominator. As more people get vaccinated, the number grows. That's why our cumulative value is able to drop.


Counts of Deaths by Manufacturer

Comparative counts of deaths from COVID-19 and alleged deaths from the vaccine, according to the VAERS dataset.


Vaccine Adverse Reactions

In this visualization, we explore the number and prevelance of vaccine reactions as a whole against the total vaccinated population in the US.


To interact with the visualizations, select an age group from the drop down menu to see the time series of percentage of vaccine reactions. You can also choose whether you want to look at fully vaccinated or partial vaccinated individuals.

Hover over the bottom chart for more details and be sure to read the additional instructions under each chart title!


Cumulative percent of vaccine reaction severity by age

Percentages are calculated based on the total vaccinated population as the denominator. As more people get vaccinated, the number grows, which means it's possible for our cumulative percent to drop.

To interact with the visualizations, select a vaccine manufacturer from the drop down menu to see the time series of percentage of vaccine reactions. You can also choose whether you want to look at fully vaccinated or partial vaccinated individuals.

Hover over the bottom chart for more details and be sure to read the additional instructions under each chart title!


Cumulative percent of vaccine reaction severity by Manufacturer

Percentages are calculated based on the total vaccinated population as the denominator. As more people get vaccinated, the number grows, which means it's possible for our cumulative percent to drop.


Vaccine Symptom Exploration and Breakdown

Let's take a look at which symptoms were most commonly reported. The crossfilter chart explores most common symptoms across manufacturer, dosage series, severity, and age range. You can filter across multiple variables by clicking and dragging your mouse across the columns that you would like to filter further. For example, if you click and drag over "Moderna" and "Dose 2" on the first two plots you should that the most common symptom is pyrexia, or a fever.

Medical Terminology

  • Arthralgia: Join pain
  • Dyspnea: Difficult or labored breathing
  • Erythema: Superficial reddening of the skin as a result of injury or irritation causing dilatation of the blood capillaries.
  • Hyperhidrosis: Excessive sweating not necessarily related to heat or exercise
  • Myalgia: Muscle pain or group of muscle pain
  • Pyrexia: Raised body temperature; fever


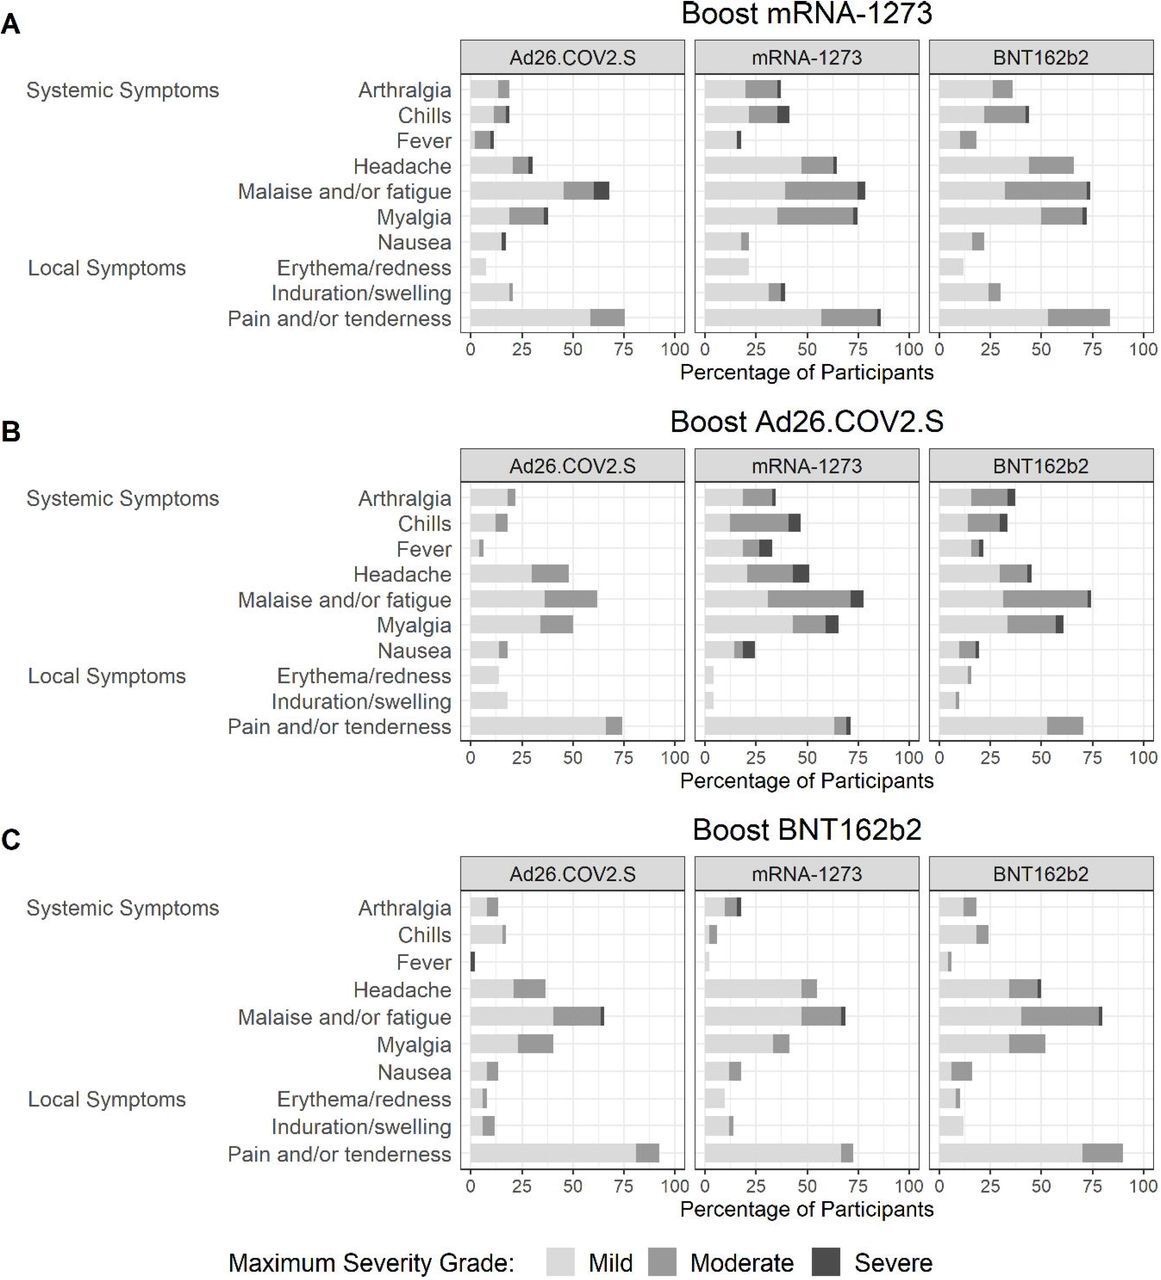
  • Lastly, we'll look at the symptoms breakdown in the VAERS dataset against published CDC data. The figure on the right (or below, depending your screen layout) is from a MedRxiv preliminary report regarding booster vaccinations. It shows symptoms reported 7 days following a booster from a given manufacturer given a primary vaccination from a given manufacturer (not necessarily the same manufacturer as the booster). Row A shows symptoms reported by individuals that received the mRNA-1273 booster and are split into 3 charts based on the primary vaccination received prior to the booster. Similarly, Row B and Row C show symptoms reported by individuals that received the Ad26.COV2.S and BNT162b2 booster respectively. For clarity, the vaccination manufacturers are as follow:

  • mRNA-1273 = Moderna
  • Ad26.COV2.S = Janssen
  • BNT162b2 = Pfizer/BioNTech

  • Symptoms were graded as mild (does not interfere with activity), moderate (interferes with activity), or severe (prevents daily activity).

    This figure is provided as a comparison and reference for the left or top (depending on layout) visualization of top symptoms from each manufacturer reported from the VAERS dataset. Though this figure looks at symptoms from a booster shot rather than from the primary vaccination regimen, it is provided to show that primary symptoms reported between the VAERS data and CDC vetted data are comparable. Furthermore it confirms the results from the VAERs symptom visualization that primary reactions are mild and non-life-threatening.


    about us

    We're a team of students from the UC Berkeley Master's in Data Science and Information program. This is our final project for w209, Data Visualization, in which we have utilized tools such as D3, Vega-lite, and Altair to succinctly convey big data. In this project, we are seeking to find creative and unique visualizations that share COVID and COVID vaccine data in a new light.

    - Dahler, Emily, Menglu, and Nicole